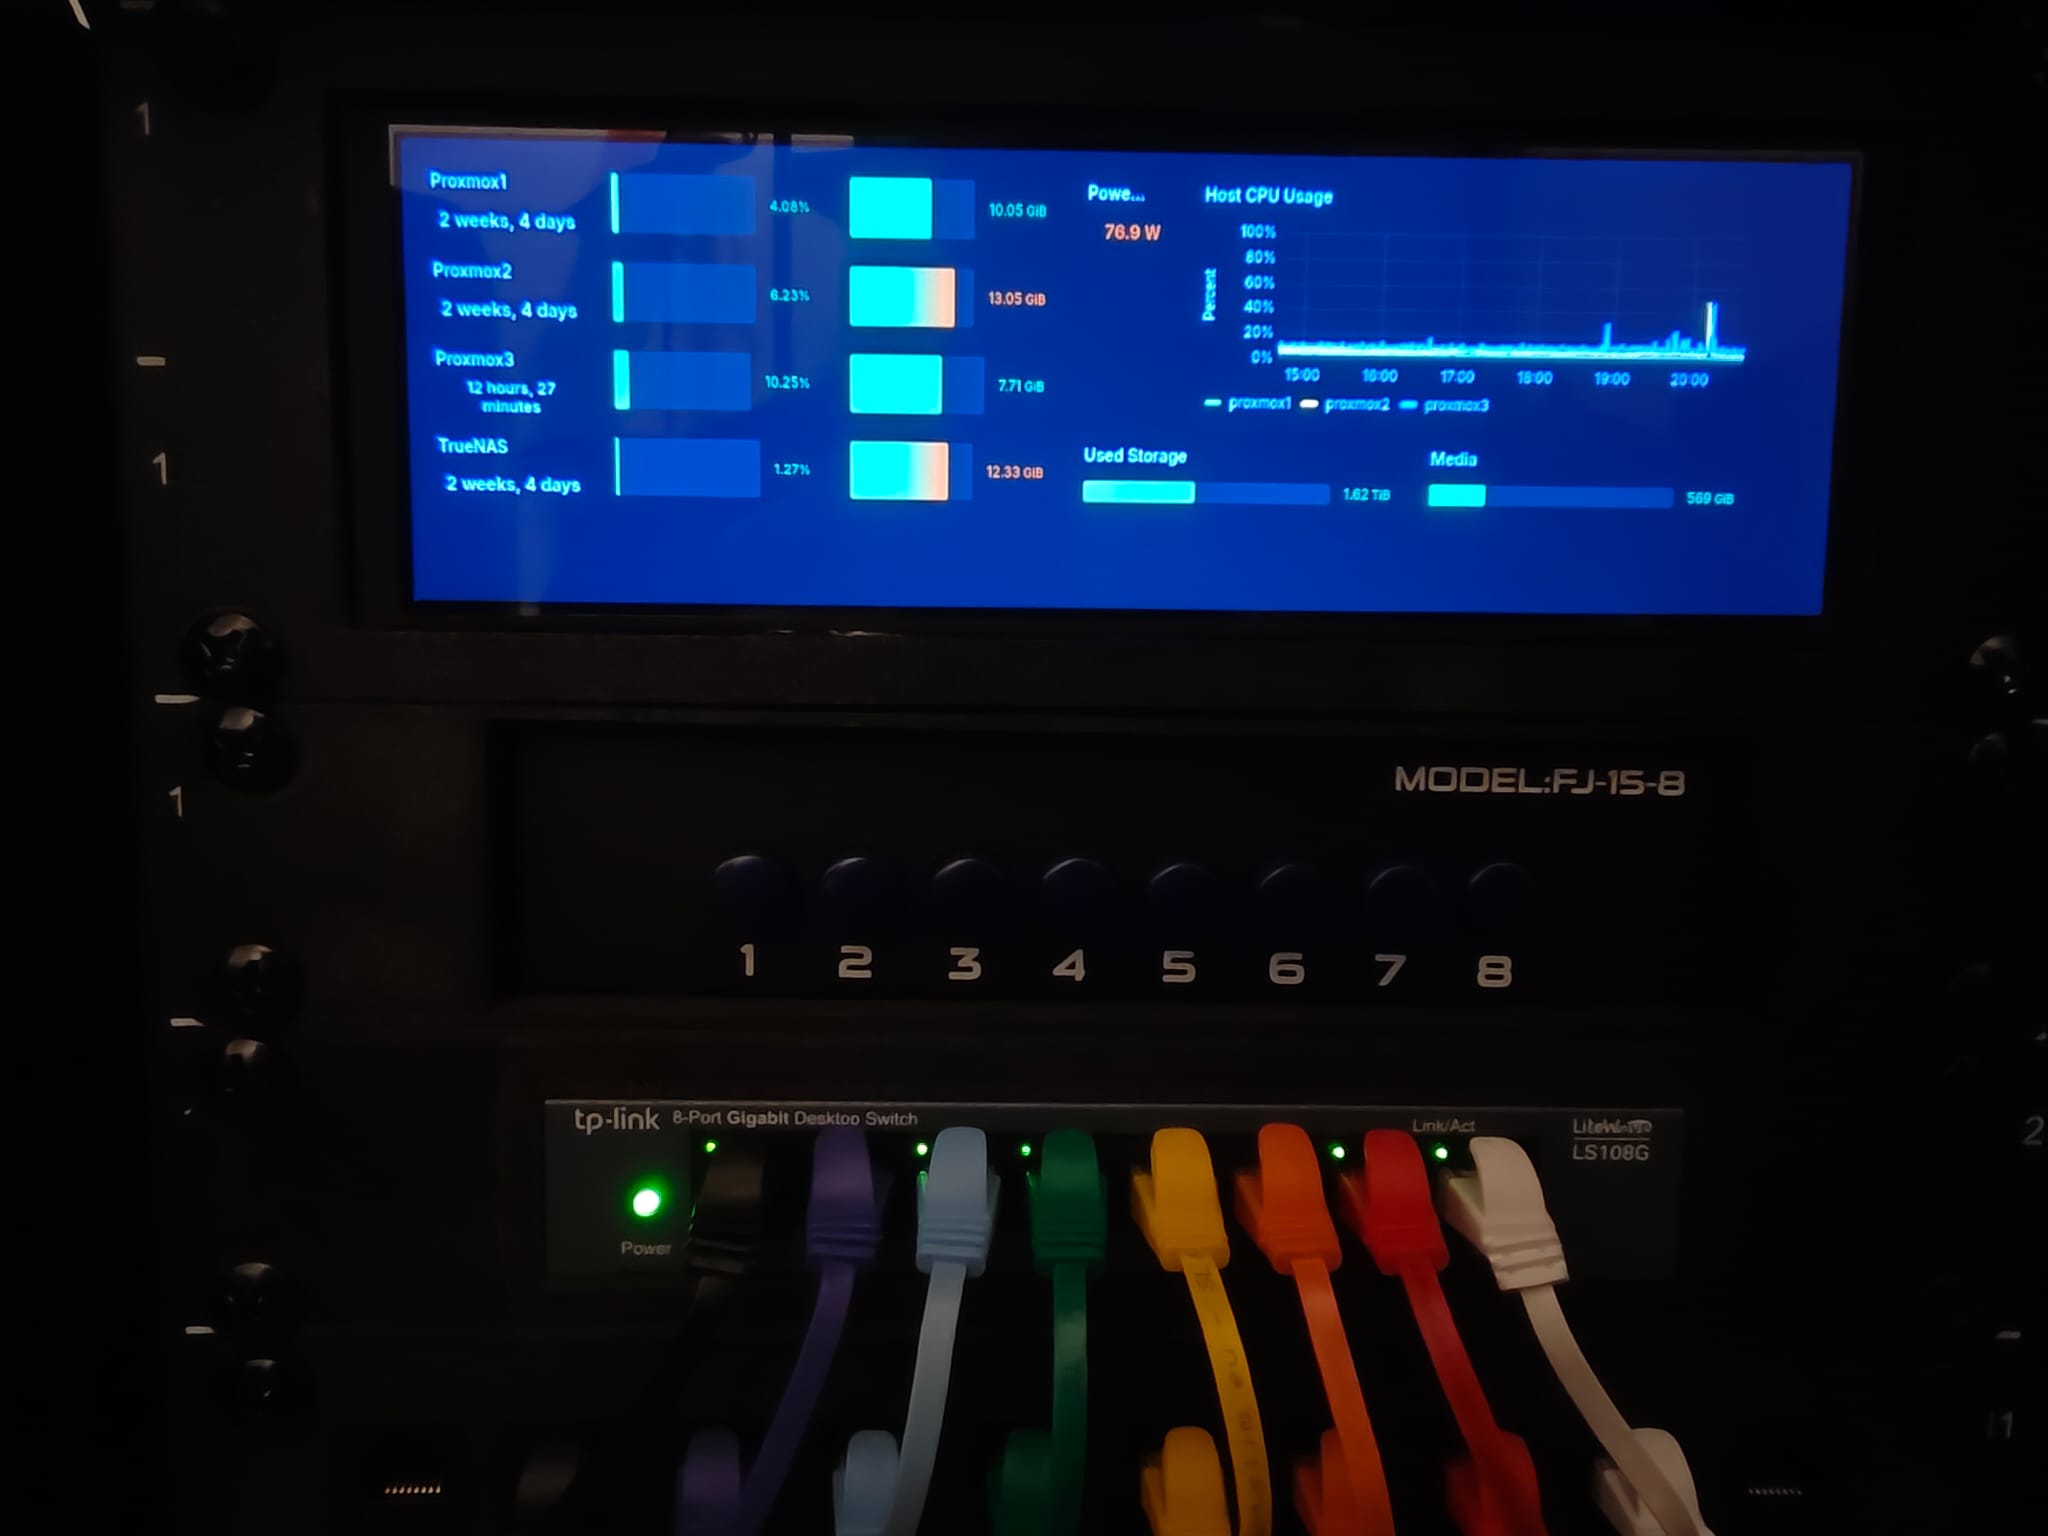
I massively upgraded my homelab’s rack, and wanted to show a grafana dashboard on an external display. My first attempts were to use a DisplayLink USB -> HDMI adapter to try and run the kiosk from a VM, but sadly I could not get it to work after many hours of tinkering. Instead, I opted to just use an X session with openbox on the proxmox host itself to show the dashboard. The display I am using is a “Wisecoco 7.84 inch 1280×400 IPS” I got off AliExpress. I mostly got this setup through ChatGPT and some fiddling.
The setup
Install the required packages
apt update
apt install --no-install-recommends \
  xserver-xorg \
  xinit \
  openbox \
  xterm \
  kitty \
  firefox-esr
xterm will be used to create a terminal when manually testing to check the connected displays. Start an x session with
startxThen open a terminal with right click and run xrandr to see which displays are connected. For me, they were HDMI-2 (the main display, connected with a display -> VGA adapter to a VGA switch) and HDMI-3 (the kiosk monitor, connected directly to an HDMI port). You may also want to create a firefox profile. This has to happen from an x session for some reason. To do this, run
firefox-esr -CreateProfile grafanaIt will create a profile directory in a folder ~/.mozilla/firefox/2wfzffhk.grafana/ (the ID may of course vary). We will use this to set some user settings, and it will store your Grafana login cookies.
To launch the Grafana dashboard through firefox (and to open a terminal on your main display with kitty), create ~/.xinitrc with the contents
#!/bin/sh

# Fail hard if something breaks (for debugging)
set -e

# Basic X settings
xset -dpms
xset s off
xset s noblank

# Monitor layout
xrandr \
  --output HDMI-2 --auto --rotate right \
  --output HDMI-3 --primary --auto --left-of HDMI-2 --mode 1920x1080

# Start window manager LAST and in foreground

openbox-session &
sleep 4

export MOZ_CRASHREPORTER_DISABLE=1
export MOZ_DISABLE_CONTENT_SANDBOX=1

firefox-esr \
    --kiosk \
    --class GrafanaDashboard \
    -P grafana \
    --no-remote \
    "http://192.168.50.34:3000/d/advzc6f/kiosk?kiosk&_dash.hideTimePicker=true&_dash.hideVariables=true" &

kitty --title "proxmox3.home" --start-as fullscreen &

wait
replacing the display names with the ones you found, and the grafana dashboard URL to your own. The --class GrafanaDashboard argument is important, as it is how we configure the firefox window, and the extra url parameters for the Grafana URL make it so the dashboard is launched in kiosk mode, with any variable and time picker selectors hidden. I set a fixed mode, so that the firefox window location is not hardcoded to an invalid or incorrect location based on some default monitor settings.
Make this file executable with
chmod +x ~/.xinitrcNext, create a config file for openbox in ~/.config/openbox/rc.xml with the following contents:
<?xml version="1.0" encoding="UTF-8"?>
<openbox_config xmlns="http://openbox.org/3.4/rc">
  <applications>
    <application class="GrafanaDashboard">
      <position>
        <x>1920</x>
        <y>0</y>
      </position>
      <fullscreen>yes</fullscreen>
      <decor>no</decor>
      <skip_pager>yes</skip_pager>
      <skip_taskbar>yes</skip_taskbar>
    </application>
  </applications>
</openbox_config>
Change the x coordinate if your main display is not a full HD montor.
Next we will set some firefox settings by creating a file ~/.mozilla/firefox/ (of course replacing the ID with that of your profile), with the contents:2wfzffhk.grafana/user.js
// Disable crash restore & session restore
user_pref("browser.sessionstore.resume_from_crash", false);
user_pref("browser.sessionstore.enabled", false);
user_pref("browser.sessionstore.interval", 0);
user_pref("browser.startup.page", 0);
user_pref("browser.startup.homepage_override.mstone", "ignore");

// Disable crash reporting & telemetry
user_pref("toolkit.crashreporter.enabled", false);
user_pref("toolkit.crashreporter.prompt", false);
user_pref("toolkit.startup.max_resumed_crashes", -1);
user_pref("browser.tabs.crashReporting.sendReport", false);
user_pref("browser.crashReports.unsubmittedCheck.enabled", false);

// Disable telemetry / health reports
user_pref("datareporting.healthreport.uploadEnabled", false);
user_pref("toolkit.telemetry.enabled", false);
user_pref("toolkit.telemetry.unified", false);
user_pref("toolkit.telemetry.server", "");
user_pref("toolkit.telemetry.archive.enabled", false);
user_pref("toolkit.telemetry.shutdownPingSender.enabled", false);
user_pref("toolkit.telemetry.bhrPing.enabled", false);
user_pref("toolkit.telemetry.newProfilePing.enabled", false);
user_pref("toolkit.telemetry.updatePing.enabled", false);

// Disable animations and smooth scrolling
user_pref("toolkit.cosmeticAnimations.enabled", false);
user_pref("general.smoothScroll", false);
user_pref("layout.css.scroll-behavior.spring-constant.low", 0);

// Disable tabs animations
user_pref("browser.tabs.animate", false);
user_pref("browser.fullscreen.animateUp", 0);

// Reduce DNS / network overhead
user_pref("network.http.pipelining", true);
user_pref("network.http.pipelining.maxrequests", 8);
user_pref("network.http.proxy.pipelining", true);
user_pref("network.http.fast-fallback-to-IPv4", true);

// Increase cache to reduce reloads
user_pref("browser.cache.disk.enable", true);
user_pref("browser.cache.memory.enable", true);
user_pref("browser.cache.memory.capacity", 65536); // 64 MB RAM cache
user_pref("browser.cache.disk.capacity", 1048576); // 1 GB disk cache

// Disable Pocket, built-in PDF viewer, and update prompts
user_pref("extensions.pocket.enabled", false);
user_pref("pdfjs.disabled", true);
user_pref("app.update.auto", false);
user_pref("app.update.enabled", false);
user_pref("browser.aboutHomeSnippets.updateUrl", "");
user_pref("browser.shell.checkDefaultBrowser", false);

// Disable "What's New" / tips / onboarding
user_pref("browser.onboarding.enabled", false);
user_pref("browser.startup.homepage_welcome_url", "about:blank");
user_pref("browser.startup.homepage_welcome_url.additional", "");

// Force fullscreen without prompts
user_pref("full-screen-api.warning.delay", 0);
user_pref("full-screen-api.warning.timeout", 0);

// Disable popups / alerts
user_pref("dom.disable_open_during_load", true);
user_pref("dom.webnotifications.enabled", false);
user_pref("dom.push.enabled", false);
At this point, your dashboard setup should just worktm. Just run startx. Finally, we create a systemd service for it. Create a file /etc/systemd/system/dashboard.service with the following contents:
# /etc/systemd/system/dashboard.service
[Unit]
Description=Start X via startx on tty1 (root)
After=systemd-user-sessions.service network.target
Wants=systemd-user-sessions.service
ConditionPathExists=/usr/bin/startx

[Service]
Type=simple
User=root
Environment=DISPLAY=:0
Environment=XAUTHORITY=/root/.Xauthority
ExecStart=/usr/bin/startx -- -keeptty
Restart=on-failure
RestartSec=3

[Install]
WantedBy=multi-user.target
and reload the systemd daemon with
systemctl daemon-reload
systemctl enable dashboard.service
systemctl start dashboard.service